Search Engine Optimization
Leverages technical and content SEO with best practices for keyword research, content audits, search interest, local search and voice search.
Paid Search & PPC
Achieve immediate results with best-in-class PPC campaigns and management, with measurable ROI, targeted advertising and increased brand awareness and website traffic.
Metasearch
Makes your brand visible across all platforms (including Google Hotel Price Ads, Trivago, TripAdvisor, Bing Ads, Skyscanner, Kayak and Wego) with continuous monitoring of cost per click and hotel visibility using experienced bid management and optimization techniques.
Digital Strategy
Provides powerful business intelligence, analysis and reporting to create a constantly evolving digital marketing strategy for all your digital marketing efforts and execution, helping you grow and stay front of mind with customers.
Digital Marketing & Hospitality Experts
A team of experts with extensive experience in Search, Display, Video and Shopping, combined with in-depth hospitality knowledge, helping you grow and make your brand more powerful online.
Google Partner
Provides access to a wide range of benefits in three key areas: education & insights, access and support, and recognition and rewards. Ensuring best-in-class PPC campaigns and digital marketing management with a return on investment of 20:1.
The world's leading intelligent & automated hotel technology hospitality platform
Find out moreCase Studies
-

-

Boudl Hotels and Resorts
How SHR Group unleashed the power of CRM and multi-product optimization
Read more -
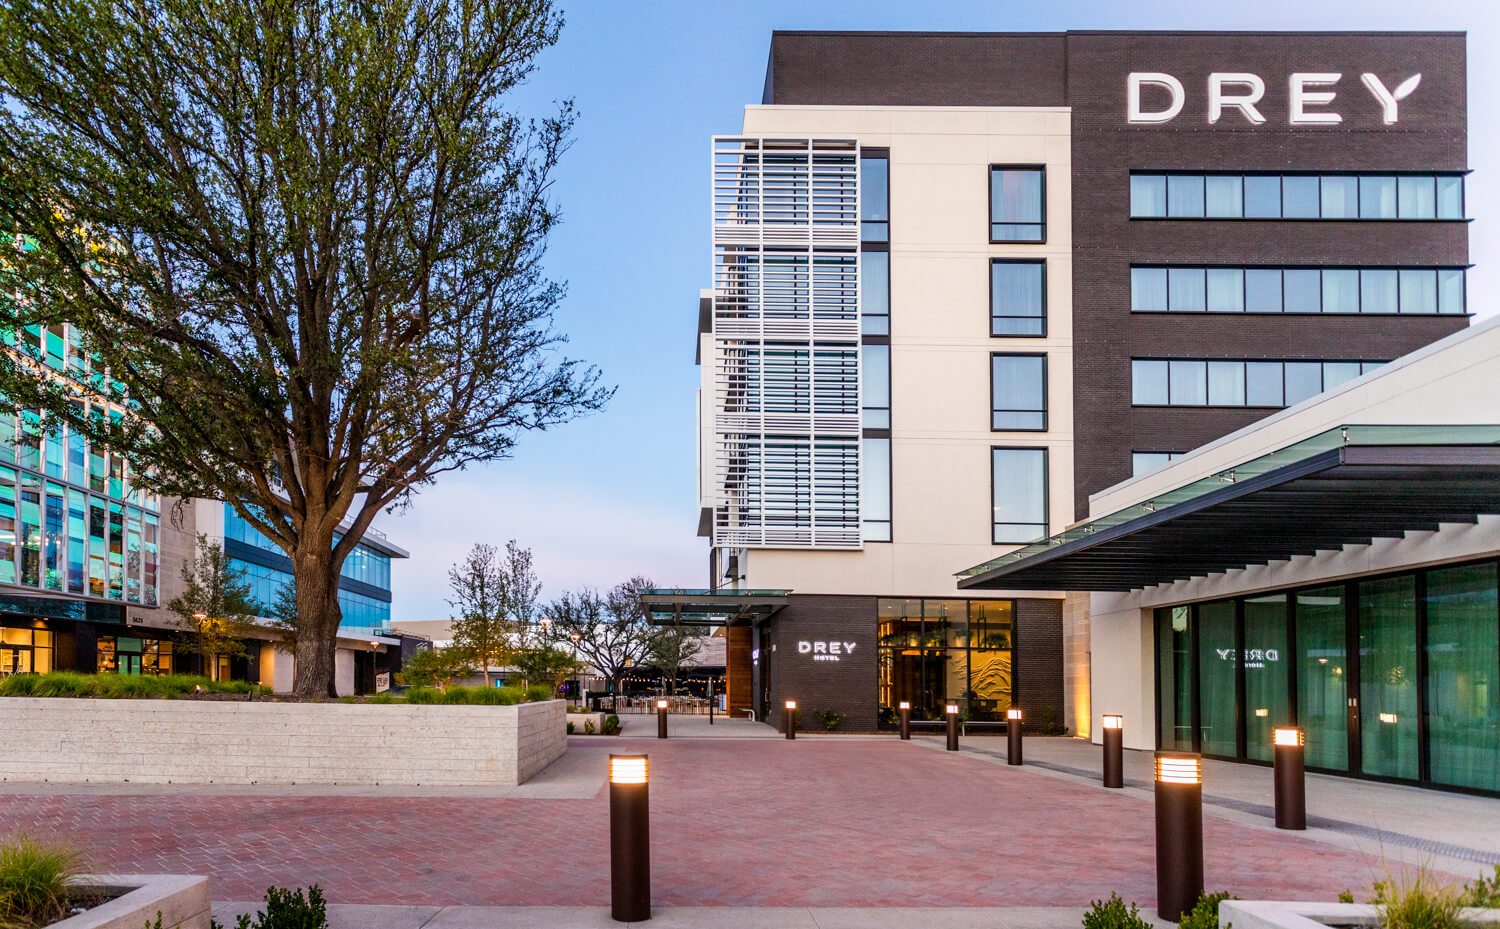
The Drey Hotel Dallas
How SHR Group played a pivotal role in formulating effective systems and strategies for growth
Read more -

-

-
-

-

Woodlands Hotel
How working with SHR Group increased direct bookings and reduced cancellations
Read more -

The Cheval Collection
How Cheval Collection increased revenue by 82% through using SHR Group’s digital expertise.
Read more